


| S.N. | Particulars | Units / Area |
|---|---|---|
| 1 | Name of District | Muzaffarnagar |
| No of Blocks | 9 | |
| No of Tehsil | 4 | |
| Population | 3543362 | |
| Soil Type | Sandy Loam, Loam | |
| Climatic Zone | WPZ | |
| Major Crops | Sugarcane,Wheat, Mustard, Paddy, Urd, Orchard | |
| 2 | Geographical Area | 2958 sq km |
| 3 | Geographical Area | 2958 sq km |
| 4 | Reported Area | 309992 ha |
| Forest | 21067 ha | |
| Barren Land | 1269 ha | |
| Pasture Land | 2938 ha | |
| Current fallow land | 4141 ha | |
| Other fallow land | 1938 ha | |
| Orchards, Perrenial trees & shrubs | 1806 ha | |
| Grazing land | 238 ha | |
| Land used in other than agriculture activities | 40715 ha | |
| 5 | Net Cultivated Area | 219269 ha |
| Rabi | 98806 ha | |
| Kharif | 217919 ha | |
| Zaid | 19545 ha | |
| 6 | Gross cultivated area | 368322 ha |
| Area cultivated more than once | 119000 ha | |
| 7 | Croping intensity | 153.20 % |
| 8 | Irrigated area | 218000 ha |
| Canal | 59782 ha | |
| Tube Well under State Govt. | 3102 ha | |
| Private Tube Wells | 154660 ha | |
| Others | 573 ha | |
| 9 | Unirrigated area | 2000 ha |
| 10 | Related agriculture credit institutions(Bank) | 173 |
| Cooperative Bank | 34 | |
| Land Development Bank | 05 | |
| Commercial Bank | 134 | |
| 11 | Agricultural Input Centre (Nos.) | |
| Agriculture | Fertilizer : 11 Seed : 18 Chemicals : 23 |
|
| Cooperative | Fertilizer : 114 Seed : 86 Chemicals : 73 |
|
| Agro | Fertilizer : Seed : 04 Chemicals : |
|
| Private | Fertilizer : 306 Seed : 223 Chemicals : 189 |
|
| Total | Fertilizer : 431 Seed : 331 Chemicals : 285 |
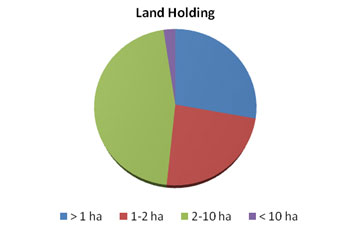
Land Holding
Large ( more than 10 ha)
No. of holdings - 298
Area (ha) - 5369
Medium ( 2-10 ha)
No. of holdings - 29854
Area (ha) - 102385
Semi medium ( 1-2 ha)
No. of holdings - 34584
Area (ha) - 53,016
Marginal (Less than 1.0 ha)
No. of holdings - 146629
Area (ha) - 62079
Literacy
Literacy (%) - 62.14
Sex ratio
Male/female - 7,70,000/4,58,000
Labour work force
Agriculture labour - 1,33,591
Non Agriculture labour- 3,27,590
S. Cane based + A.H+ Horticulture
S. Cane based + A.H+ Vegetable + Floriculture
A.H + Labour
| S.N. | AES | Characteristics of AES | Major Commodities | Farming System | Blocks |
|---|---|---|---|---|---|
| 1 | AES-1 | More than 85% Area, Sandy Loam Soil | S.Cane, Wheat, Rice, Jowar, Mango, Potato | S. Cane based + A.H+ Horticulture | Purkaji, Morna & Jansath |
| 2 | AES-2 | More than 95% irrigated, Loam | S.Cane, Wheat, Rice, Jowar, Mango,Guava, Litchi , Frenchbean | S. Cane based + A.H + Horticulture | Baghra & Sadar |
| 3 | AES-3 | More than 95%, Sandy Loam | S.Cane, Wheat, Jowar, Brinjal, Cabbage, Gladiolus, Tuberose, | S. Cane based + A.H+ Vegetable+ Floriculture | Charthawal, Khatauli |
| 4 | AES-4 | Low Water table area, Loam & Sandy Loam soil | S. cane, Wheat, urd, Jowar, Mango | S. Cane based + A.H + Horticulture | Budhana & Shahpur |
| S.N. | Soil Type | Characteristics | Area (ha) |
|---|---|---|---|
| 1 | Sandy | Soil particle Diameter (mm) : 2 - 0.2 mm, Water holding capacity : Poor |
17633 |
| 2 | Sandy Loam | Soil particle Diameter (mm) : 0.2 - 0.02 mm, Water holding capacity : Medium |
128334 |
| 3 | Loam | Soil particle Diameter (mm) : 0.02 - 0.002 mm Water holding capacity : Average |
78186 |
| 4 | Clay Loam | Soil particle Diameter (mm) : than 0.002 mm Water holding capacity : Good |
5126 |
| Total | Soil particle Diameter (mm) : Water holding capacity : |
219269 |
| S.N. | Crop | Area (ha) | Production (qt) | Productivity (Qt./ha) |
|---|---|---|---|---|
| 1 | Sugarcane | 201436 | 151752584 | 586.00 |
| 2 | Wheat | 127085 | 452000 | 35.57 |
| 3 | Paddy | 22302 | 559111 | 25.07 |
| 4 | Urd | 1174 | 14400 | 4.38 |
| 5 | Lentil | 636 | 257 | 4.04 |
| 6 | Gram | 133 | 140 | 10.53 |
| 7 | Pea | 230 | 3300 | 14.35 |
| 8 | Pigeon Pea | 108 | 214 | 19.81 |
| 9 | Mustard | 3937 | 5397 | 13.71 |
| 10 | Sunflower | 58 | 689 | 11.88 |
| 11 | Potato | 3260 | 74983 | 230.01 |
| 12 | Cotton | 274 | 356 | 1.30 |
| 13 | Maize | 200 | 2540 | 12.70 |
| 14 | Arhar | 118 | 770 | 6.53 |
| Month | Rainfall (mm) | Temperature C | Relative Humidity (%) |
|---|---|---|---|
| April 2014 | 1.7 | Maximum : 34.3 Minimum : 17.5 |
41.1 |
| May 2014 | 37.8 | Maximum : 38.7 Minimum : 21.8 |
40.5 |
| June 2014 | 21.2 | Maximum : 33.7 Minimum : 23.4 |
72.0 |
| July 2014 | 210.8 | Maximum : 32.6 Minimum : 24.3 |
82.5 |
| August 2014 | 107.4 | Maximum : 32.3 Minimum : 23.4 |
80.0 |
| September 2014 | 74.3 | Maximum : 33.1 Minimum : 22.0 |
73.0 |
| October 2014 | 0.27 | Maximum : 31.83 Minimum : 19.14 |
|
| November 2014 | 0.08 | Maximum : 28.25 Minimum : 11.38 |
|
| December 2014 | 17.6 | Maximum : 20.00 Minimum : 5.4 |
|
| January 2014 | 27.2 | Maximum : 16.5 Minimum : 7.6 |
|
| February 2015 | 0.42 | Maximum : 25.62 Minimum : 13.28 |
|
| March 2015 | 3.00 | Maximum : 27.38 Minimum : 14.79 |
| Month | Rainfall (mm) | Temperature C | Relative Humidity (%) |
|---|---|---|---|
| April 2014 | 1.7 | Maximum : 34.3 Minimum : 17.5 |
41.1 |
| Category | Population | Production | Productivity |
|---|---|---|---|
| Cows | |||
| Crossbred | 35460 | 413514 liter/day | 1800-3178 liter/lactation |
| Indigenous | 133459 | 413514 liter/day | 1200-2270 liter/lactation |
| Buffalo | 194306 | 1790140 liter/day | 1360-2270 liter/lactation |
| Sheep | |||
| Crossbred | 223 | Wool - 11873 kg/ year | |
| Indigenous | 8478 | Wool - 11873 kg/ year | |
| Goats | 20429 | 5294 mt | 180-544 lit/lactation |
| Pigs | |||
| Crossbred | 10543 | 12012000 kg meat | |
| Indigenous | 24856 | 12012000 kg meat | |
| Rabbits | 281 | ||
| Poultry | |||
| Hens | |||
| Desi | 54502 | 163589 kg meat | 1.0 kg |
| Improved | 109087 | 163589 kg meat | 1.0 kg |
| Ducks | 1642 | ||
| Turkey | 19 | ||
| Camel | 41 | ||
| Fisheries | |||
| Fish | 1239 | 40887 qt | 30-35 |
| S.N. | Taluk | Name of Block | Name of The Village | Major Crops & Enterprises | Major Problem Identified | Identified Thrust Areas |
|---|---|---|---|---|---|---|
| 1 | Sadar | Baghra | Narottampur, Haidernagar | Sugarcane | Low yield due to imbalance fertilizer | Balance use of fertilizer |
| Wheat | Low yield due to high infestation of weeds | Weed management | ||||
| Mustard | Poor yield due to aphid infestation | Insect mgt. | ||||
| Mango | Poor yield due to no use of micronutrients | Fertilizer management | ||||
| Guava | Poor quality yield due to fruit fly infestation | Fruit fly management | ||||
| Cauliflower | Poor yield due to use of local variety | Introduction of HYV | ||||
| Brinjal | Poor quality of fruits due to foot & shoot borer | IPM | ||||
| 2 | Khatauli | Khatauli | Gangdhari, Bhangela, Rukanpur | Sugarcane | High infestation of insect & disease | Insect & disease mgt. through IPM |
| Gladiolus | Low yield due to use of local variety and rotten corm | Introduction of HYV Disease mgt. | ||||
| Mustard | Poor yield due to aphid infestation | Insect mgt. | ||||
| Vegetables | Local variety, Imbalance fertilizer application, Infestation of pest | Introduction of HYV, IPNM, IPM | ||||
| 3 | Jansath | Jansath | Mantodi, Mukalmpur | Sugarcane | Poor yield due to no use of organic matter | Promoting of organic manure |
| Wheat | Low yield due to imbalance use of fertilizer | IPNM in Wheat | ||||
| Merigold | Use of local seed High infestation of disease | Introduction of HYV Disease mgt. | ||||
| Vegetables | Local variety, Imbalance fertilizer application, Infestation of pest | Introduction of HYV, IPNM, IPM | ||||
| Barseem | Low yield due to local seed | Introduction of HYV | ||||
| 4 | Budhana | Budhana, Shahpur | Shahdabbar, Jiwana | Sugarcane | Low yield of Sugarcane | Introduction of HYV Balance fertilizer application IPNM & IPM |
| Mango | Low yield of Mango | IPNM & IPM Rejuvenation of old orchard Introduction of regular bear variety | ||||
| Wheat | Low yield | Water management IPM Weed mgt. Introduction of HYV | ||||
| Barseem | Low fodder production | Timely sowing Introduction of HYV | ||||
| 5 | Sadar | Charthawal | Rohana kala | Sugarcane | Low yield due to imbalance fertilizer | Balance use of fertilizer |
| Wheat | Low yield due to high infestation of weeds | Weed management | ||||
| Mustard | Poor yield due to aphid infestation | Insect mgt. | ||||
| Makhan Grass | Low fodder production | Introduction of new Fodder |
| Crop / Enterprise | Thrust Area |
|---|---|
| Sugarcane | IPNM, SSNM, Weed management, IPM, IDM, Seed production |
| Wheat | Integrated Nutrient Management, Weed management, IPM, IDM, Seed production, Foliar application of Micronutrients |
| Rice | IPNM, Weed management, Hybrid rice, IPM, IDM, Seed production |
| Vegetables | IPNM & IPM |
| Oilseeds & Pulses Crop | Sulphur, Zinc application & IPM |
| Animals | Endo & Ecto parasite control, Improving fertility |
| S. N. | Month | General Rainfall | Year |
|---|---|---|---|
| 1 | January | 37.10 | 2008 : 3.4 2009 : 0.6 2010 : 17.4 2011 : 18.2 2012 : 22.8 |
| 2 | February | 38.30 | 2008 : 60.0 2009 : 0.4 2010 : 23.3 2011 : 23.4 2012 : 1.0 |
| 3 | March | 20.10 | 2008 : 32.2 2009 : 2010 : 30.7 2011 : 28.5 2012 : 18.5 |
| 4 | April | 10.60 | 2008 : 2009 : 21.2 2010 : 38.8 2011 : 0.4 2012 : 35.8 |
| 5 | May | 14.10 | 2008 : 14.0 2009 : 57.2 2010 : 38.4 2011 : 70.6 2012 : 4.8 |
| 6 | June | 89.20 | 2008 : 107.2 2009 : 199.6 2010 : 37.6 2011 : 192.6 2012 : 1.8 |
| 7 | July | 270.40 | 2008 : 72.0 2009 : 188.6 2010 : 33.1 2011 : 132.9 2012 : 173.0 |
| 8 | August | 268.70 | 2008 : 233.2 2009 : 93.4 2010 : 32.2 2011 : 312.8 2012 : 311.0 |
| 9 | September | 160.30 | 2008 : 129.2 2009 : 96.2 2010 : 31.0 2011 : 86.8 2012 : 94.0 |
| 10 | October | 22.80 | 2008 : 2009 : 15.2 2010 : 31.6 2011 : 2012 : |
| 11 | November | 3.90 | 2008 : 2009 : 20.02 2010 : 26.7 2011 : 2012 : 4.8 |
| 12 | December | 13.80 | 2008 : 7.6 2009 : 2010 : 22.0 2011 : 2012 : 10.3 |
| Total | 949.3 | 2008 : 658.8 2009 : 658.8 2010 : 692.4 2011 : 866.2 2012 : 677.8 |